Research and Technology Portfolio
(back to Portfolios page)
Below is a compilation of the research and technological development projects I either headed or co-headed throughout the years.
Tap on a project name for further details.
DBL SmartCity
DBL SmartCity was an experimental prototype of a big data platform based on various database technologies (SQL, NoSQL, graph), Hadoop, HFS, Spark, Kafka/NATS, Node.js, and others.
Platform Architecture
The figure below shows the main data layers in the platform architecture. The data streams in from the "things" (devices) in the bottom, through the intermediate layers, to the top layer (applications).
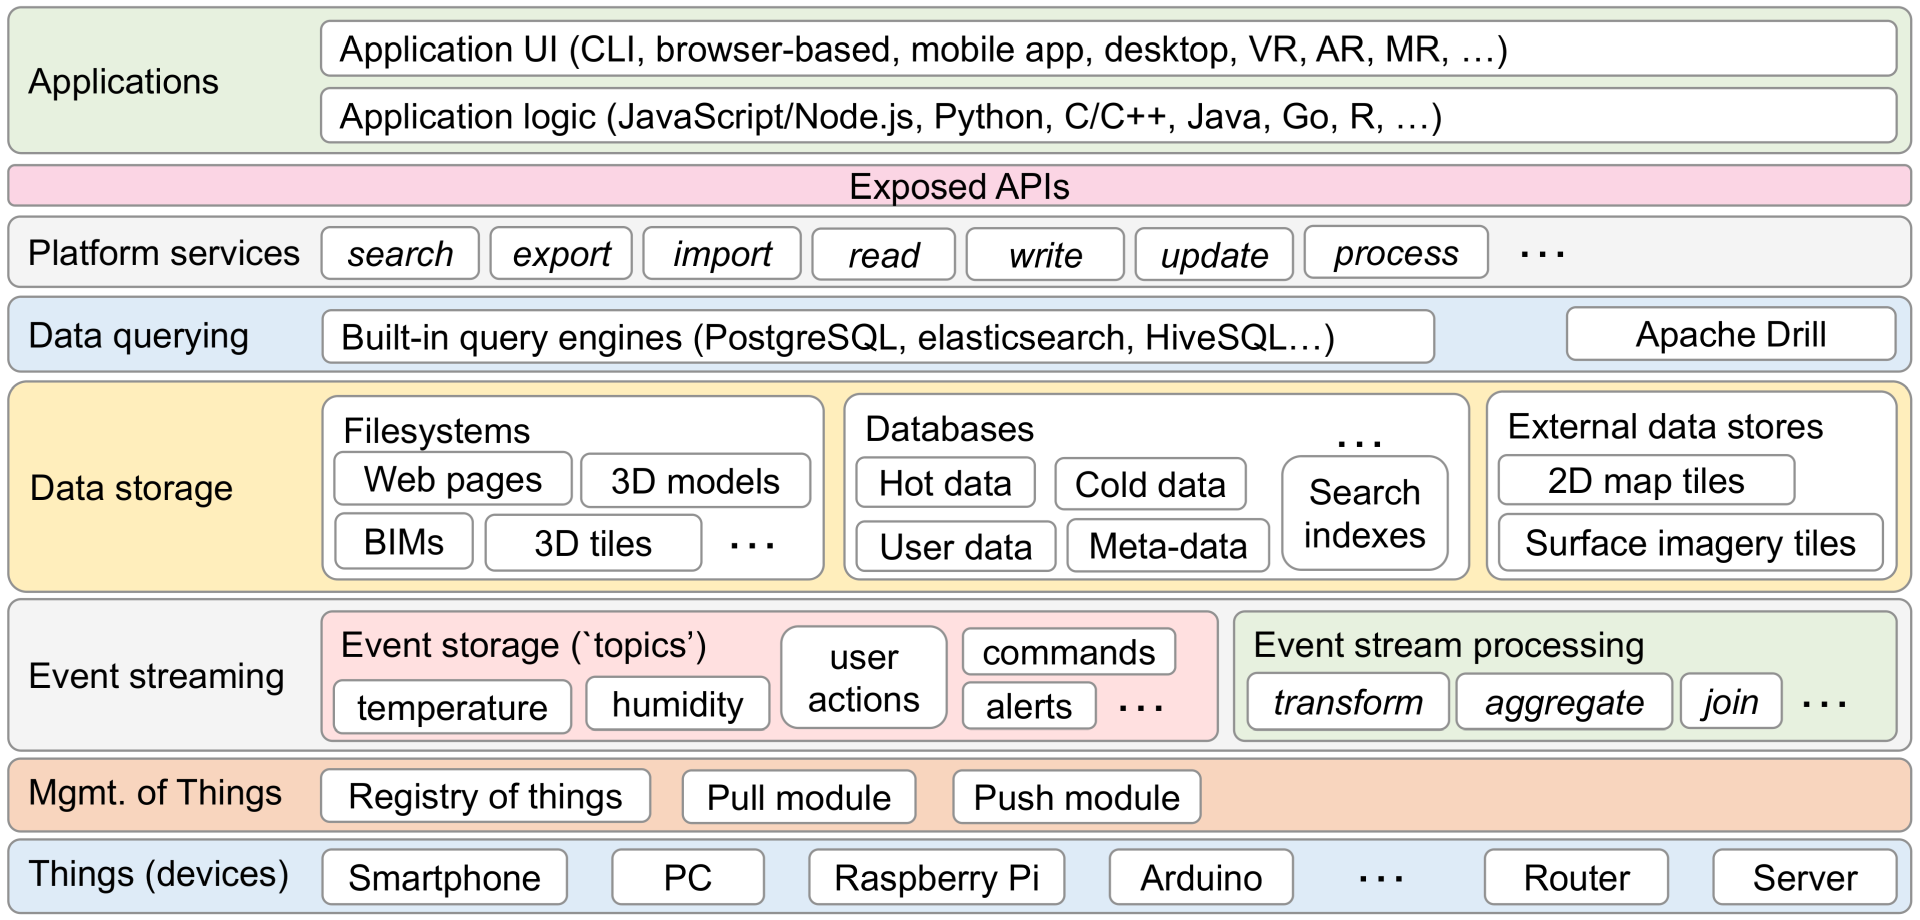 The architecture of the DBL SmartCity platform, comprising eight layers.
Interactive 3D Client
The following figure shows a screenshot of the experimental WebGL client prototype for this platform. It is based on the Cesium.js library and a host of other JavaScript libraries.
The client features a streaming 3D geometry view at the top (showing 3D models of buildings, terrain, and annotation data), as well as six views showing various scalar data (temperature, counts, alerts) pertaining to the selected 3D object.
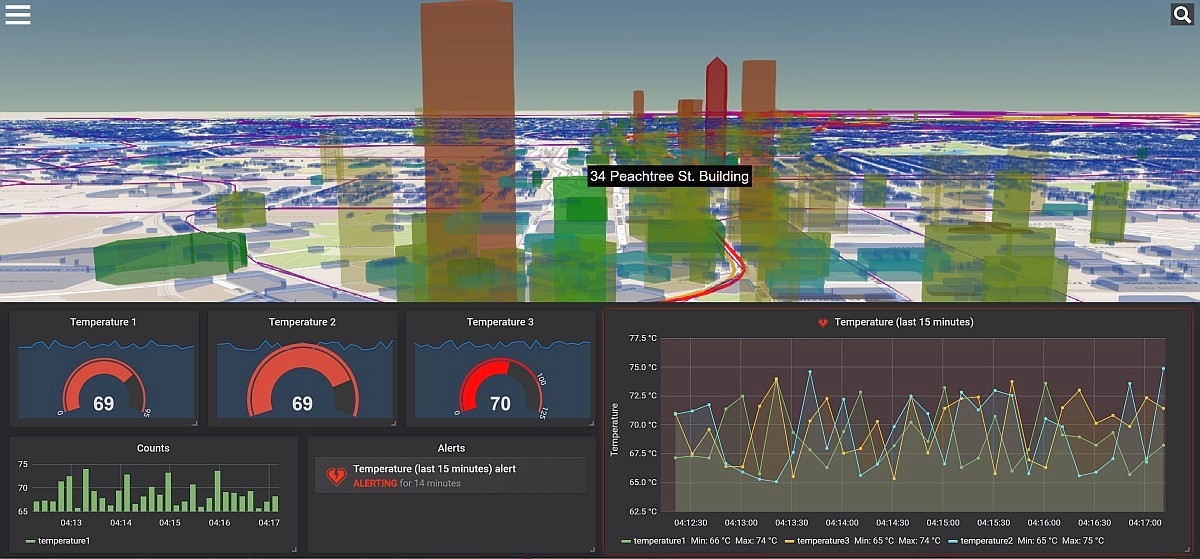 The experimental DBL SmartCity web client (dark mode).
Relevant Disciplines
Disciplines that were relevant for this project included Big Data, Smart City and Digital Twin paradigms, HCI (human-computer interaction), IxD (interaction design), UX (user experience), systems engineering, system architecture, and cloud computing.
S. Kolarić, D. Shelden (2019) DBL SmartCity: An Open-Source IoT Platform for Managing Large BIM and 3D Geo-Referenced Datasets, Proceedings of the 52nd Hawaii International Conference on System Sciences (HICSS-52), Grand Wailea, Maui, HI. https://doi.org/10.24251/HICSS.2019.238
CAMBRIA Interactive Tools
The CAMBRIA project produced a series of interaction design artifacts related to the class of “multi-state” parametric CAD tools. In other words, tools that support working with multiple parametric design models in parallel.
Early-Stage Sketching
The figure below shows an example of ideation having been done by manually sketching possible approaches to interaction in CAMBRIA, by using markers on a whiteboard. Using this technique, the overall goal was to determine basic mechanisms through which, by combining different parts of certain artefacts (for example, bicycles, wheelbarrows, …), one could come up with a multitude of different yet related designs.
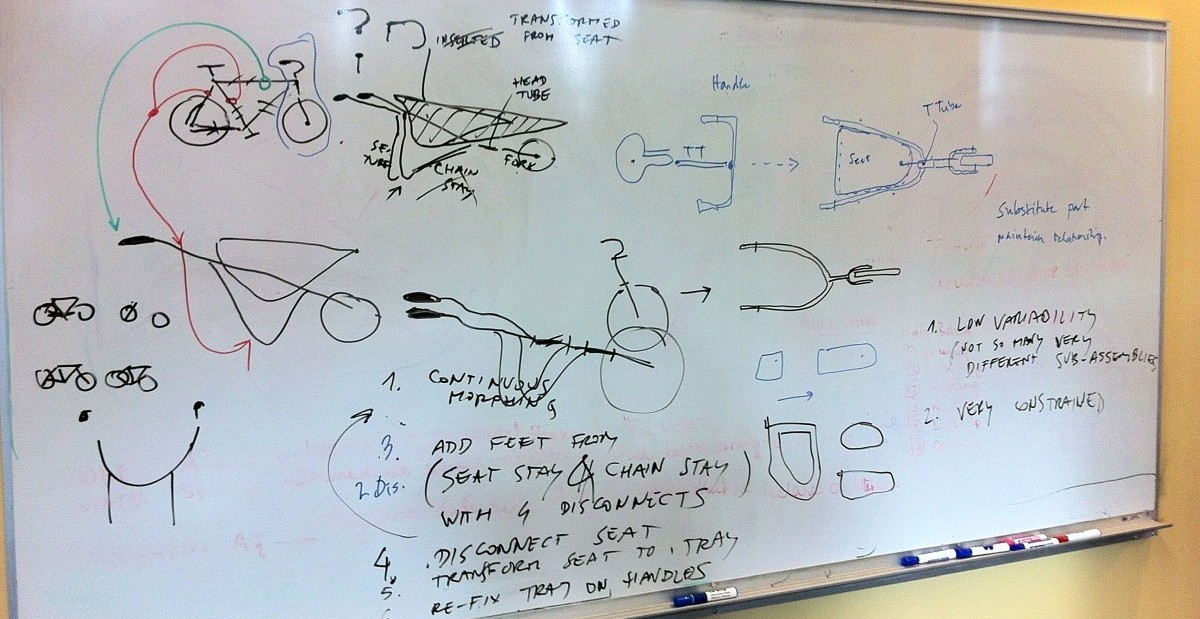 Early-stage interaction sketches: parallel editing of analogous parts for two different yet related designs: a bicycle design, and a wheelbarrow design.
Early-Stage Storyboarding
The figure below shows a storyboard developed for CAMBRIA, in order to further explore the space of possible design solutions.
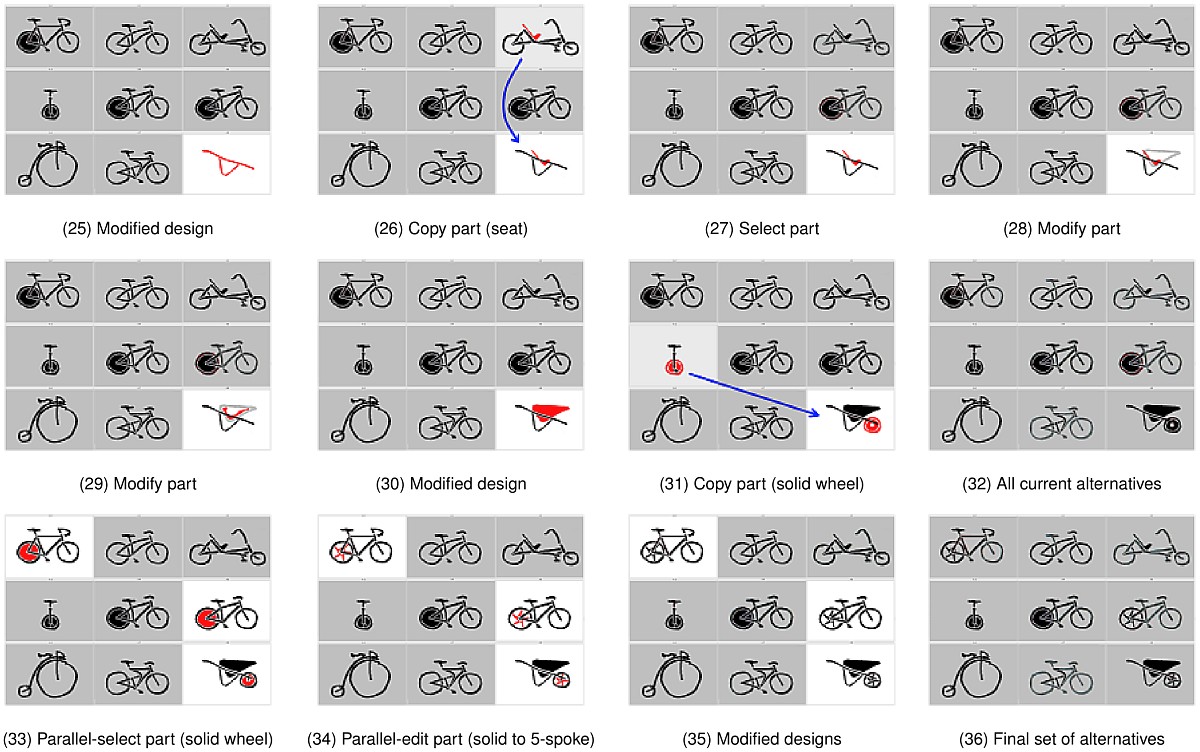 Early-stage storyboard for CAMBRIA.
Prototypes
The following figure shows the main interface of a higher-fidelity CAMBRIA protoype.
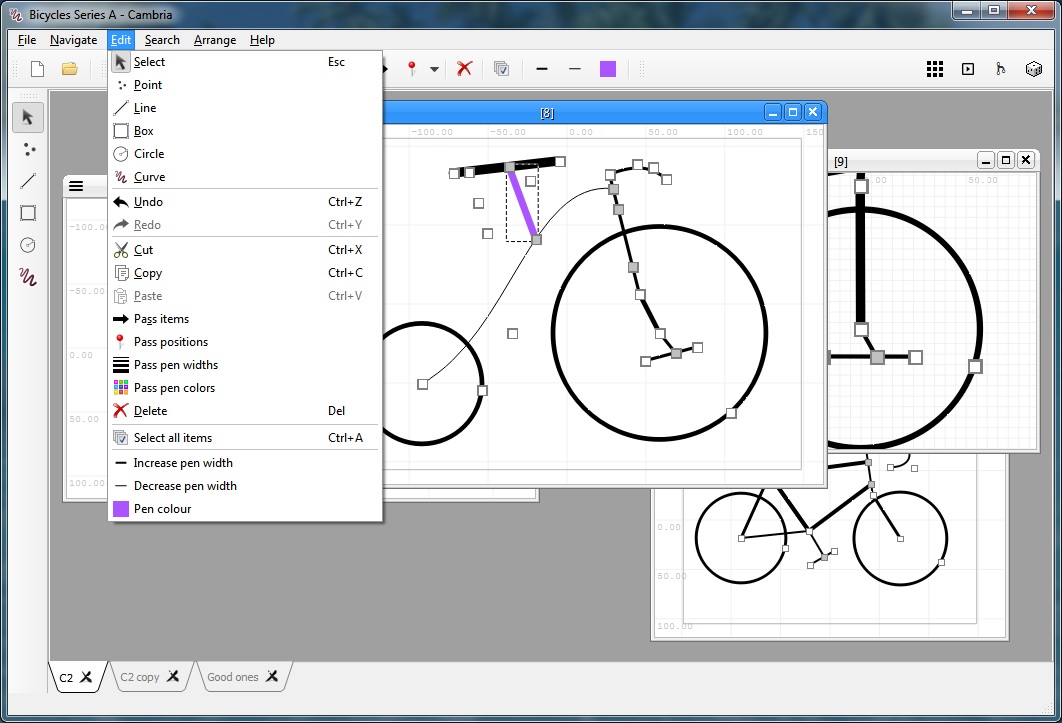 Screenshot of the CAMBRIA prototype (main interface).
The following screenshot shows CAMBRIA with four different “arrangements” of alternatives: (1) grid, (2) slideshow, (3) design history, and (4) “random” arrangements.
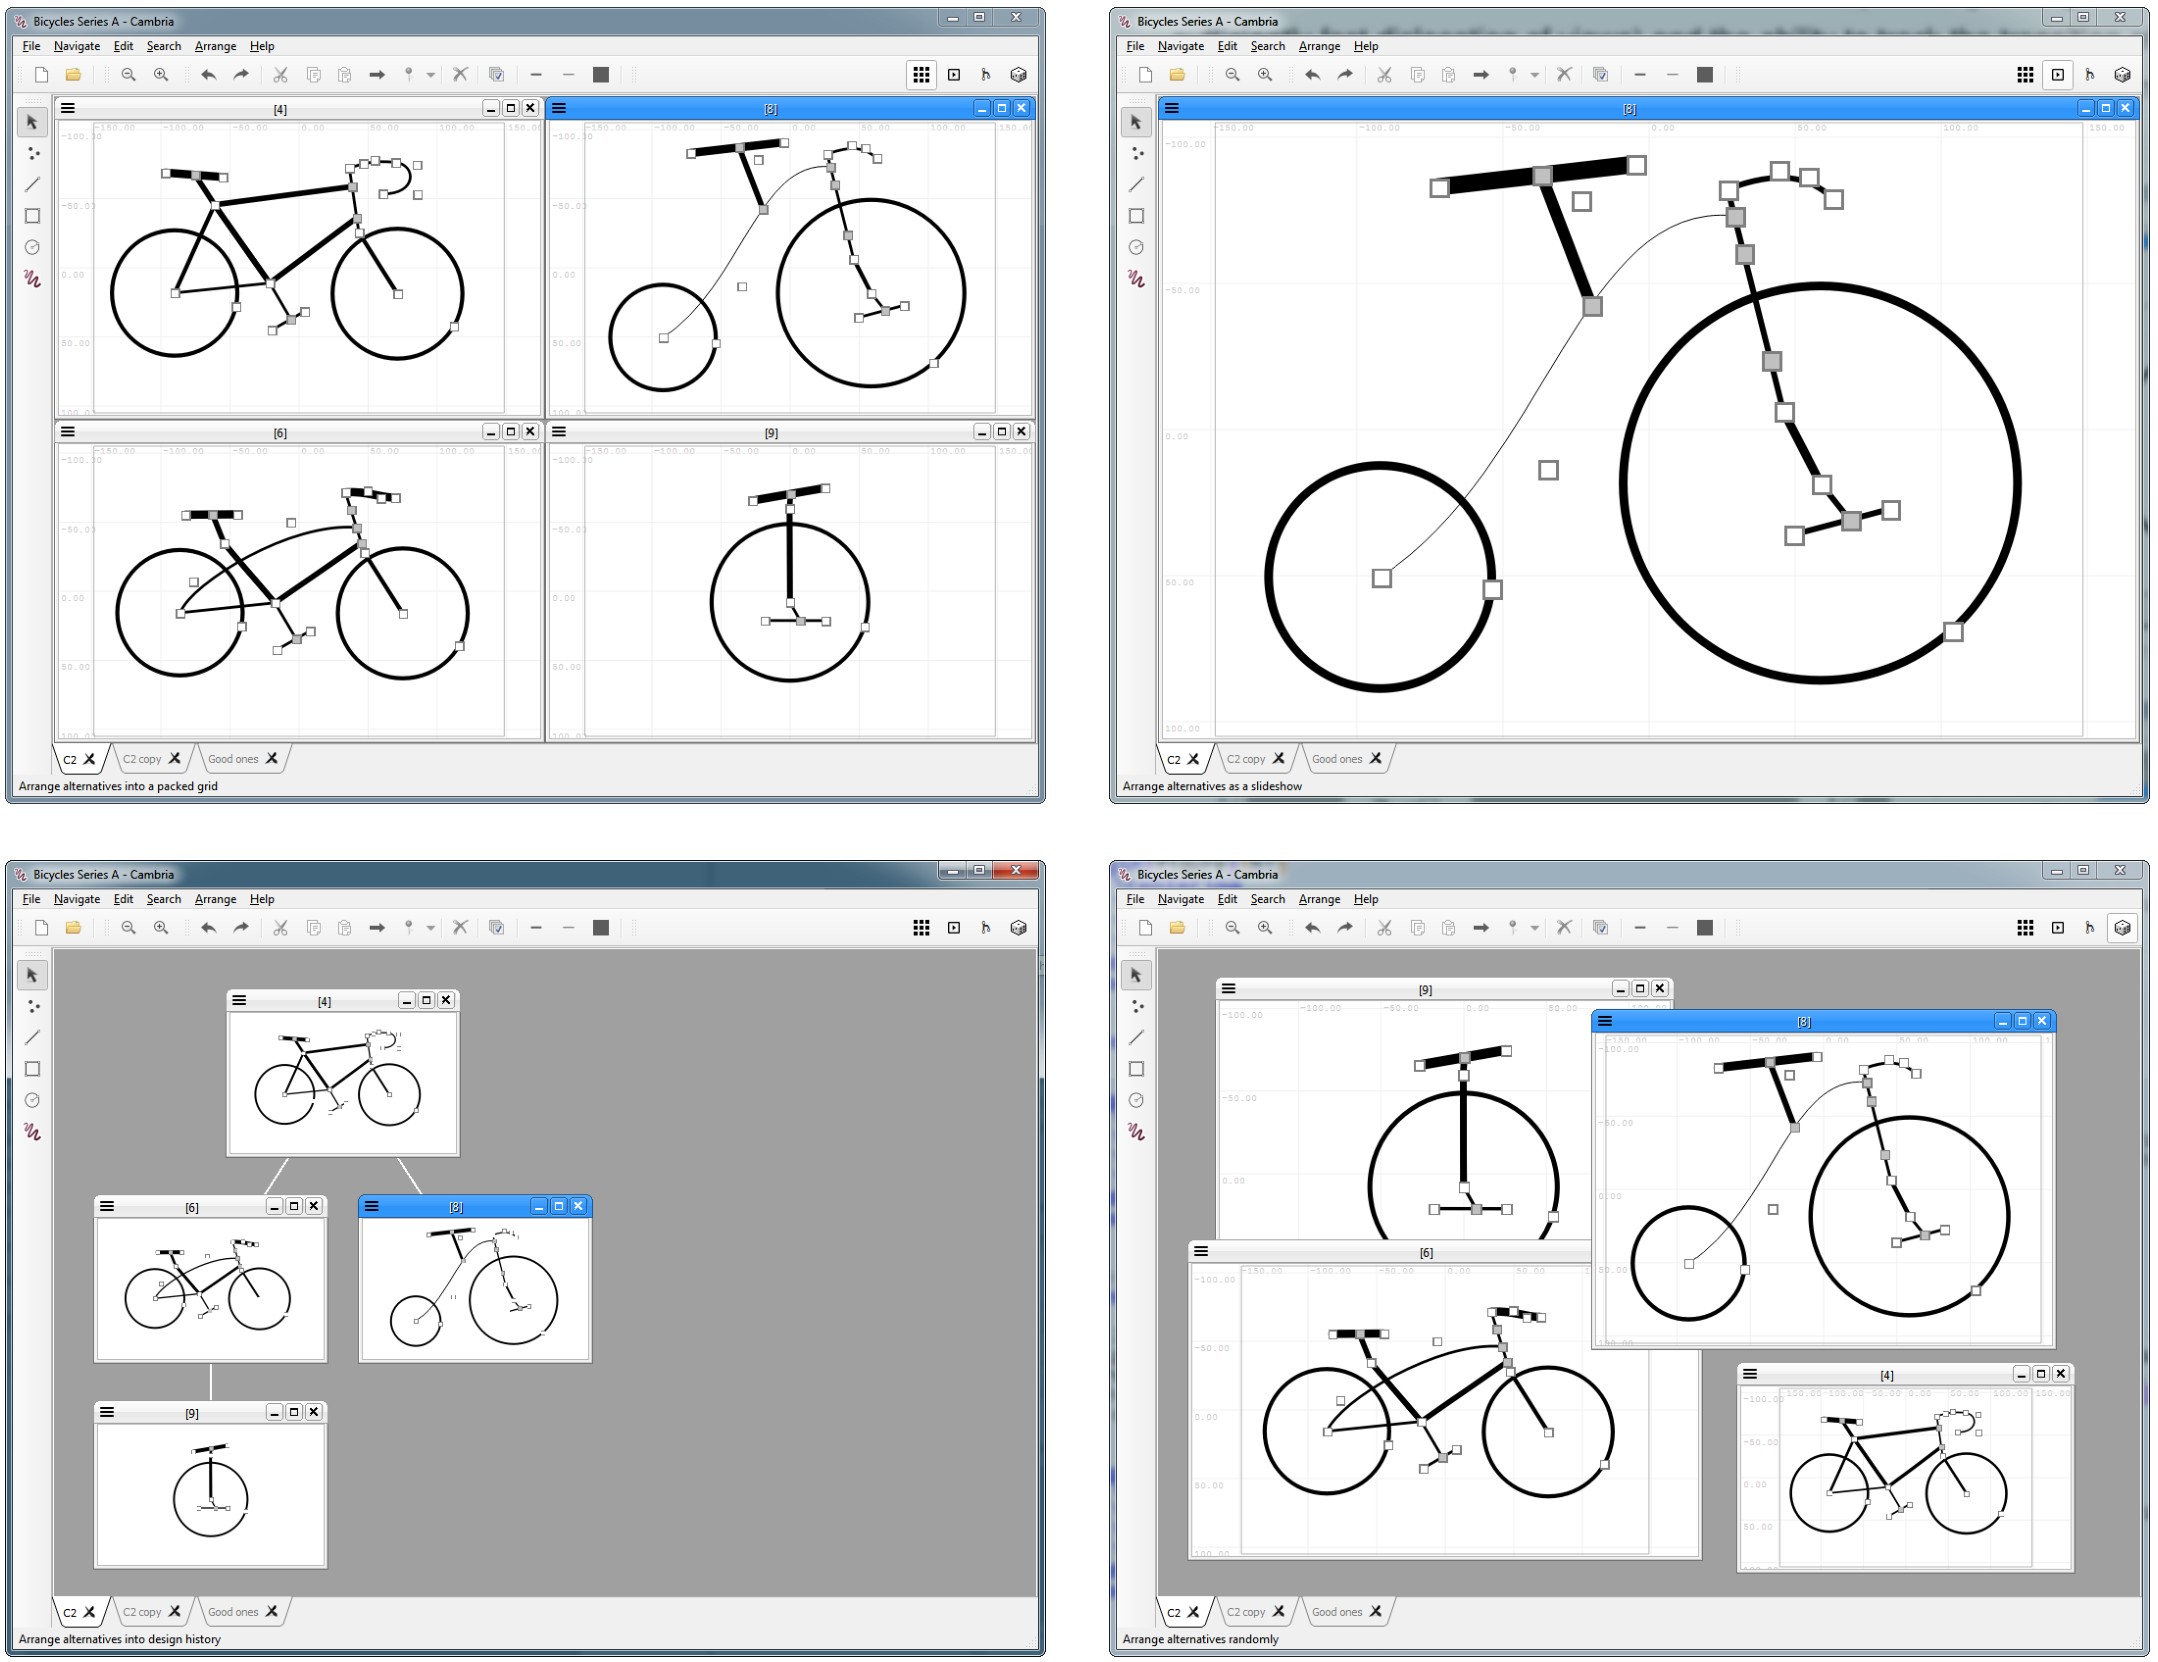 CAMBRIA prototype showing four parallel parametric design models, and four different arrangements.
"Think-aloud” Evaluation
In the first evaluation study of CAMBRIA, six renowned HCI experts were recruited for a formative evaluation, with the main purpose being to obtain a high-level, qualitative feedback on the prototype. The experts were encouraged to “think aloud” as they explored and interacted with the prototype. Each expert's session was recorded using video and audio equipment. The figure below shows the analysis ("coding") of a participant's session, conducted using the NVivo qualitative analysis software.
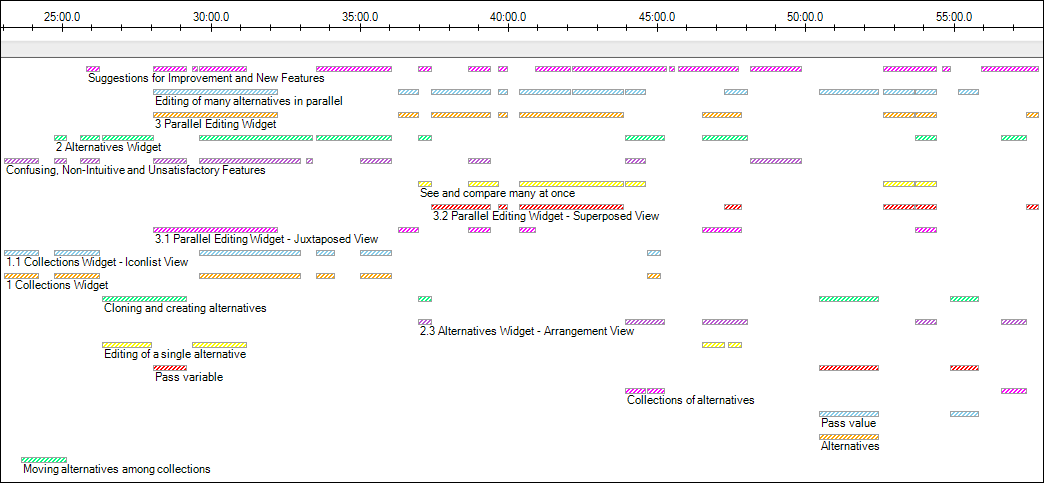 A participant's interview, coded into recurrent themes.
Analytical Evaluation of the User Interface
In the second study, the prototype was evaluated using an analytical method based on the Cognitive Dimensions (CD) framework by Blackwell, Green, et al. For each of the dimensions (visibility, juxtaposability, hidden dependencies, error-proneness, and abstraction gradient), CAMBRIA was assigned a descriptive score such as “good”, “adequate”, “poor”, and "non-existing". The latter two scores ("poor” and "non-existing") called for design interventions indicated in the rightmost column of the table below.
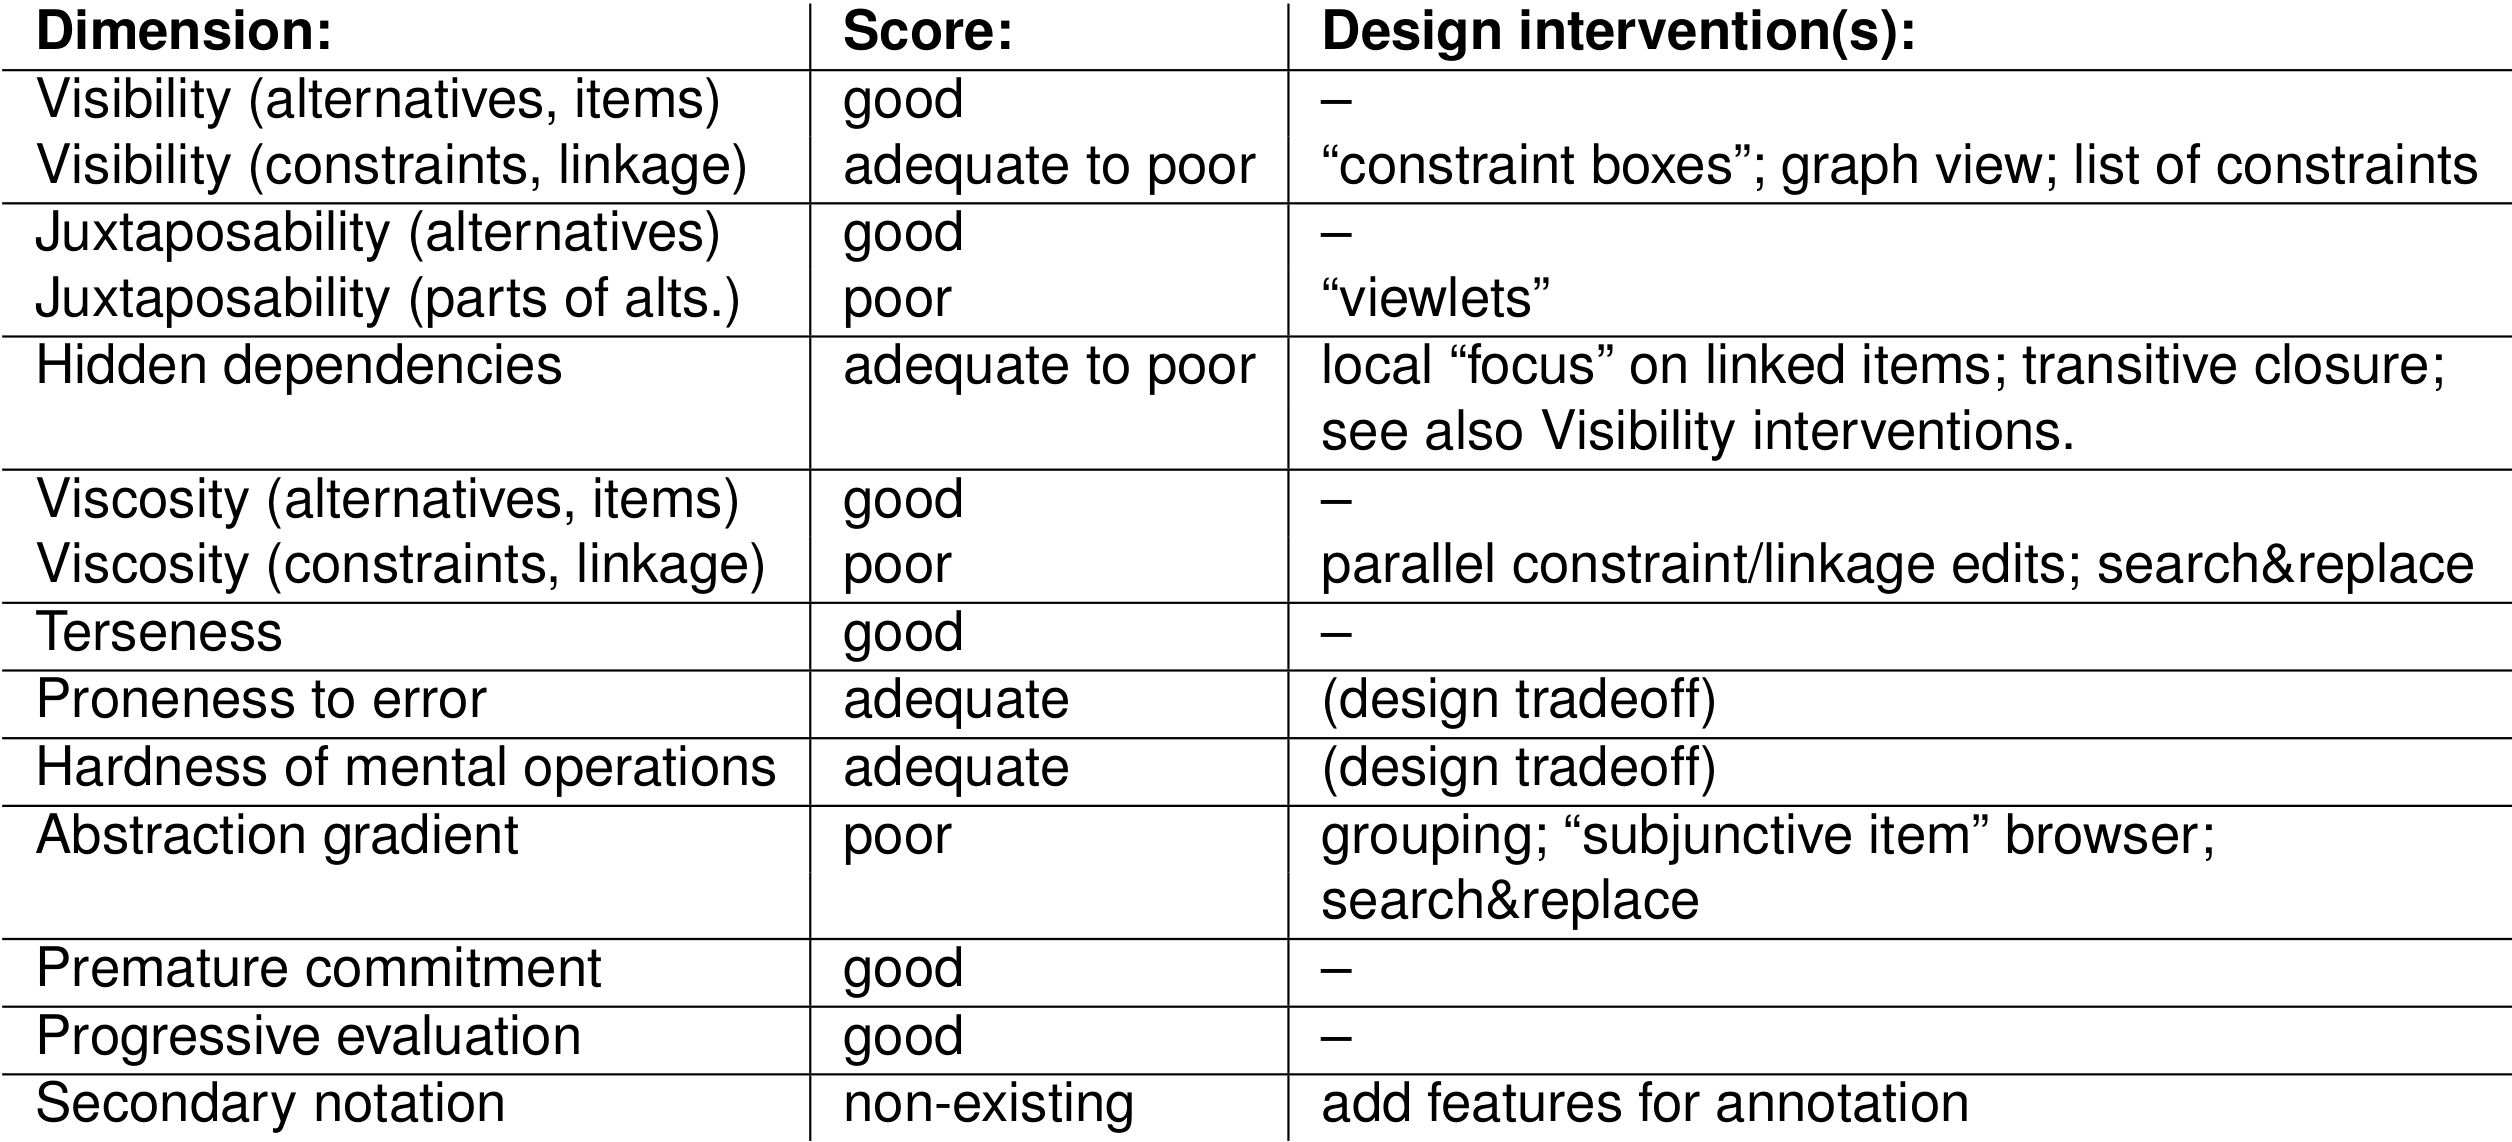 Evaluating cognitive dimensions of the CAMBRIA prototype.
A representative conference paper on CAMBRIA:
S. Kolarić, H. Erhan, R. Woodbury (2017) CAMBRIA: Interacting with Multiple CAD Alternatives. In: Çağdaş G., Özkar M., Gül L., Gürer E. (eds) Computer-Aided Architectural Design. Future Trajectories. CAADFutures 2017. Communications in Computer and Information Science, vol 724. Springer, Singapore. https://doi.org/10.1007/978-981-10-5197-5_5
Comprehending CAD Models
In this study, I developed and experimentally evaluated two GUI prototypes (named “split” and “integrated”) in the domain of parametric CAD modeling. Participants in the study (n = 13) were asked to perform a number of 3D model comprehension tasks, using both interfaces. The goal of the study was to determine which of these two interfaces led to a better comprehension of the 3D model, when rendered using the wireframe visualization mode.
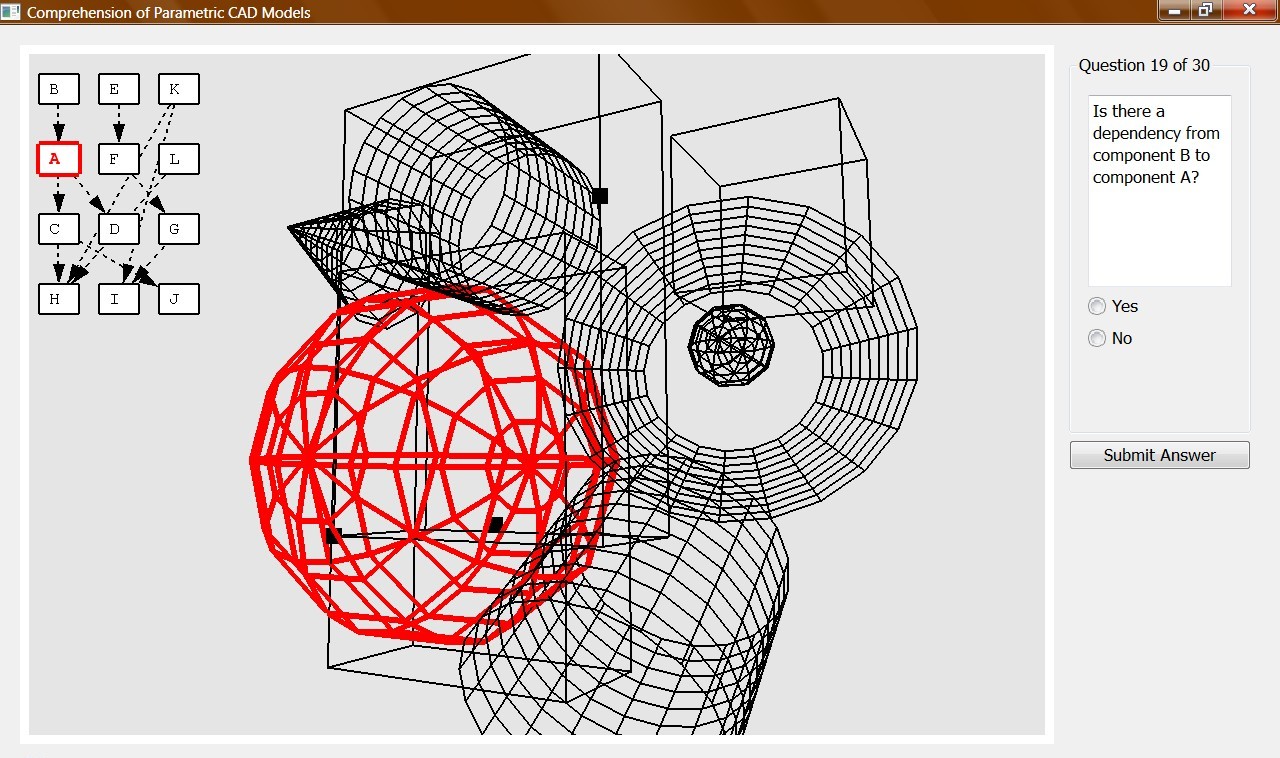
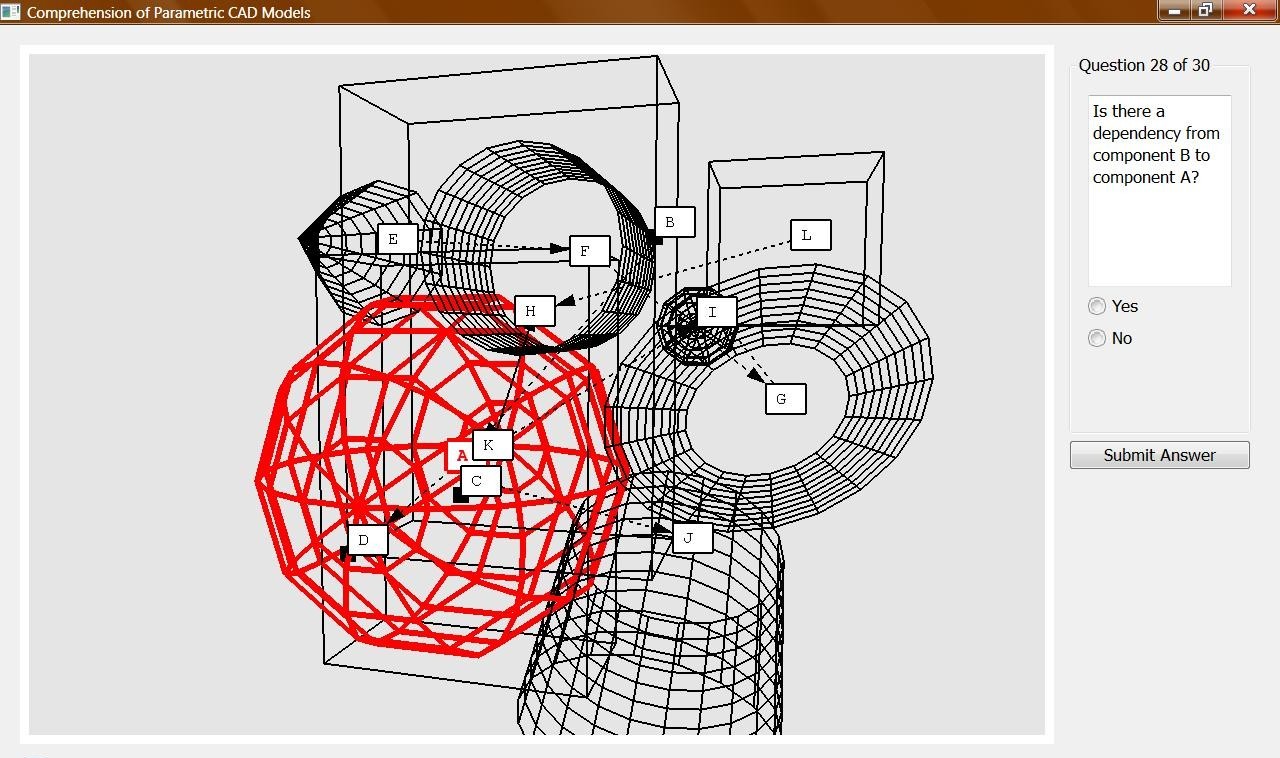
The “split” interface prototype developed for this study consisted of the dependency graph and its associated diagram showing geometric parts, placed side-by-side.
The “integrated” interface prototype developed for this study consisted of one topo-geometric diagram that combines elements from the “split” interface into one unified interface.
Evaluation Study (Quantitative)
The metrics measured in this study were the task completion times, error rates, and user satisfaction for both interfaces. The figure shows an example of the dependent (observed) variables observed in this study, in this case the mean task completion times.
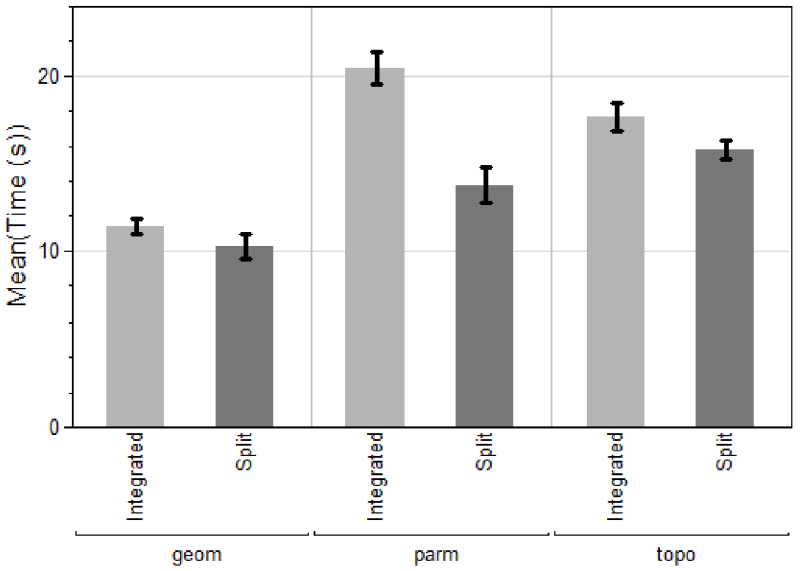 Mean task completion times, grouped by both interface type and task type.
Table below (results of paired-samples t-tests for logarithms of task completion times) shows that all three types of tasks take on the average significantly longer to complete when using the Integrated interface, than the Split interface. Furthermore, the Split interface gets progressively better than the Integrated interface in the following order (c.f. p-values): topo → geom → parm.
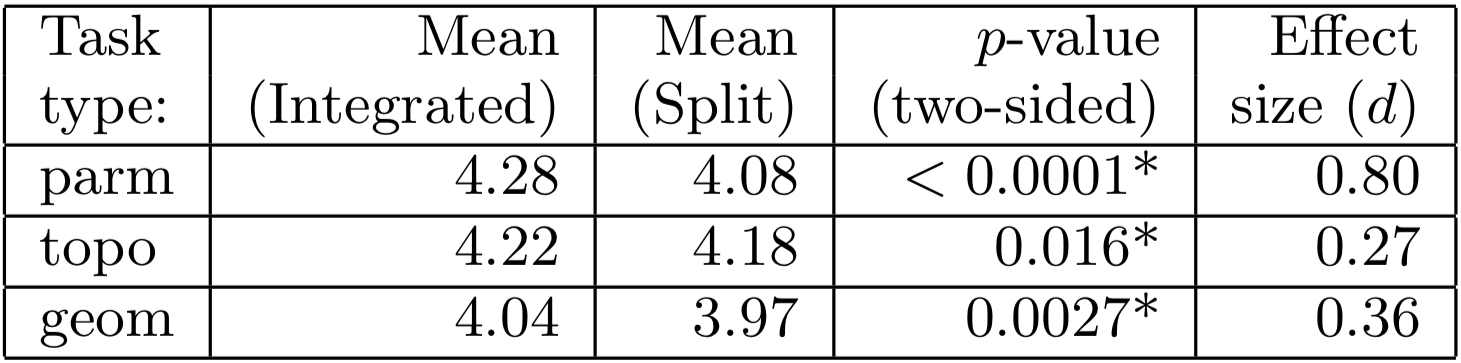 Paired-samples t-tests for logarithms of task completion times.
S. Kolarić, H. Erhan, B. Riecke, R. Woodbury: Comprehending Parametric CAD Models: An Evaluation of Two Graphical User Interfaces, short paper, Proceedings of the 6th Nordic Conference on Human-Computer Interaction (NordiCHI 2010), Reykjavik, Iceland, p.707-710 (2010). https://doi.org/10.1145/1868914.1869010
Vision-Based 3D Manipulation
This project was concerned with developing a prototype of an interactive Mixed Reality application for direct spatial manipulation, based on the vision-based recognition of uninstrumented hands. The prototype dynamically integrated both of the user’s hands into the virtual 3D/4D environment, effectively creating a logical 2 × 3 DoF manipulation device. In conjuction with hand gestures, this afforded a number of fundamental 3D manipulation operations like select, deselect, translate, rotate, and scale.
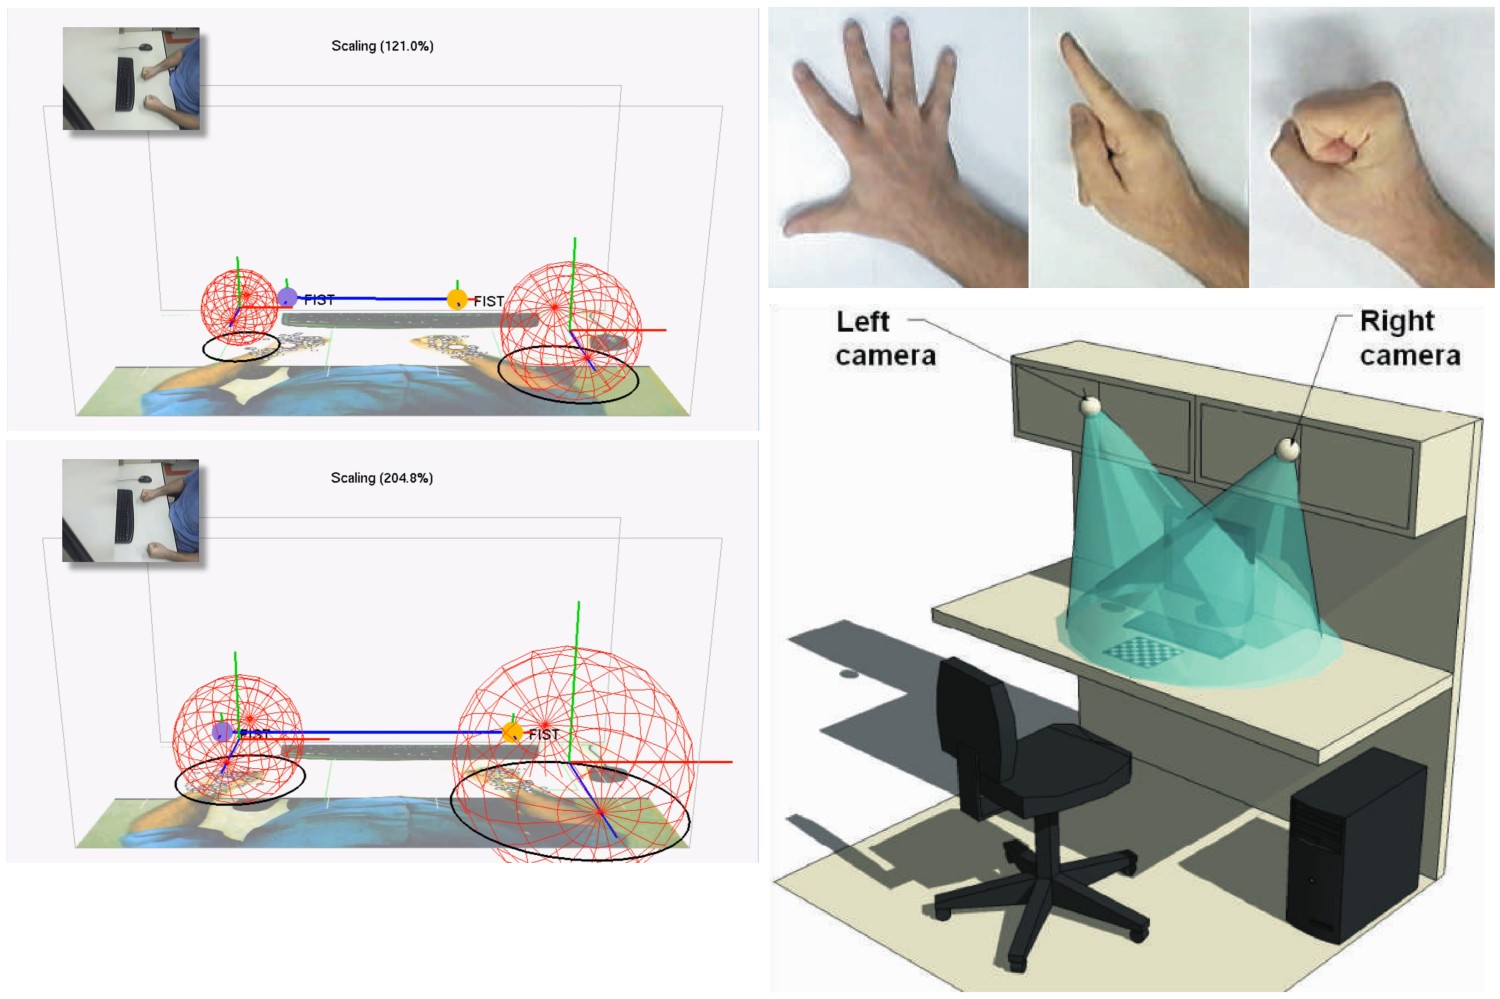 Direct 3D manipulation using vision-based recognition of uninstrumented hands.
Evaluation Study (Quantitative)
Using the system described, I measured tracking-related latencies from 7 to 30ms with just one hand tracked (i.e. with two trackers active), and up to 60ms with both hands tracked (i.e. with all four trackers active). Interaction frame rates ranged from 8 to 15 fps (frames per second).
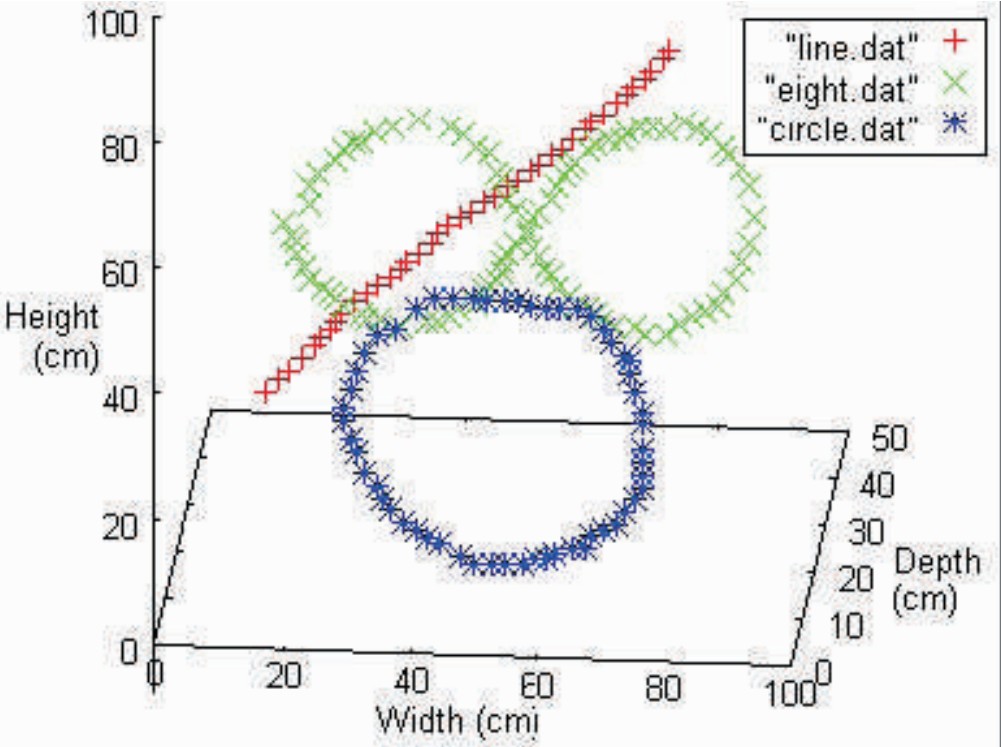 Three-dimensional plot of estimated hand positions, obtained by tracing a line, a circle, and the figure "eight" in space.
I also quantitatively assessed estimation accuracy for a hand’s position, as shown in the figure above, from which one can visually deduce the amount of noise present in tracked positions.
S. Kolarić, A. Raposo, M. Gattass: Direct 3D Manipulation Using Vision-Based Recognition of Uninstrumented Hands, full paper, X Symposium on Virtual and Augmented Reality (SVR 2008), Conference Proceedings, João Pessoa, PB, Brazil, p.212-220 (2008). download at CiteSeerX
A Hierarchical Model of Design Knowledge
This project is concerned with developing a formal model of design knowledge, named the CDH hierarchical model, which helps design practitioners and design researchers to better understand, explain, map, and acquire various bodies of design knowledge ("BDKs").
The figure below shows the CDH model with its three main levels: context, design state, and high-level design knowledge, as well as some typical BDKs found at each level.
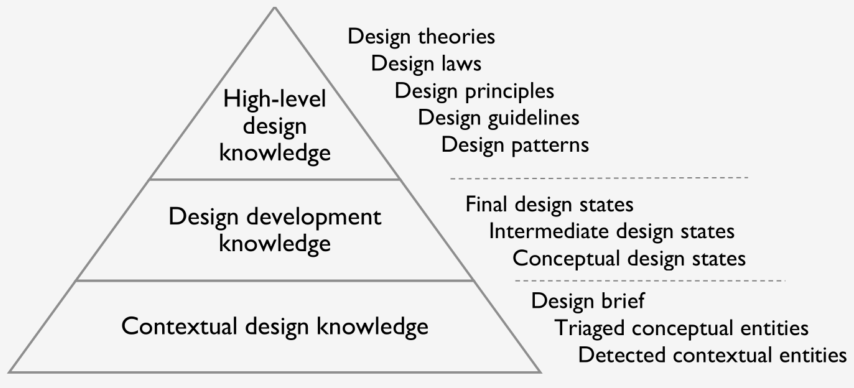 The CDH hierarchy of design knowledge.
The paper:
S. Kolarić, J. Beck, E. Stolterman: On the Hierarchical Levels of Design Knowledge, full paper, Proceedings of the Design Society, DESIGN Conference, Cambridge University Press (2020). https://doi.org/10.1017/dsd.2020.330
Data Warehouse + OLAP + custom ETL process
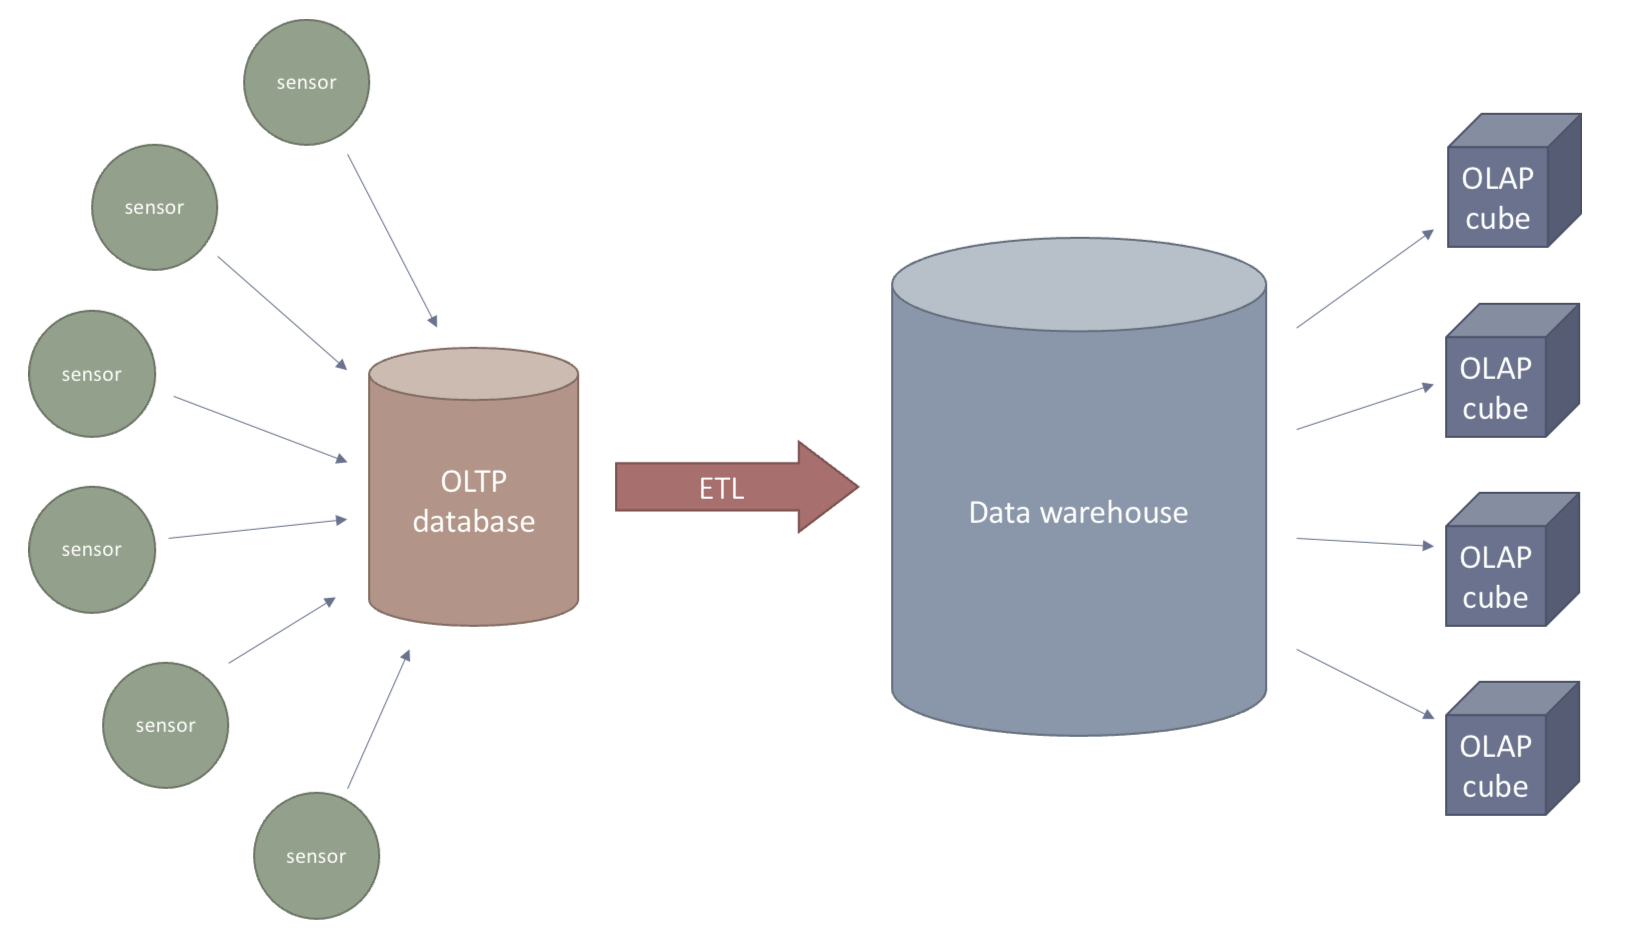
This project was concerned with developing an OLTP database + ETL process + data warehouse + OLAP solution for managing and visualizing various types of industrial data (such as temperature, pressure, and count series) from the manufacturing floor of the main Audi factory in Ingolstadt, Germany.
Data from the OLTP Oracle clustered database was fed into a large, long-term data warehouse (also implemented in clustered Oracle) using a custom-written ETL process in PL/SQL. Finally, this warehousing data was then used to build OLAP cubes, using Microsoft Analysis Services.
The figure below shows the schematics of this data warehousing solution.
 OLTP database + custom ETL process + data warehouse + OLAP solution.
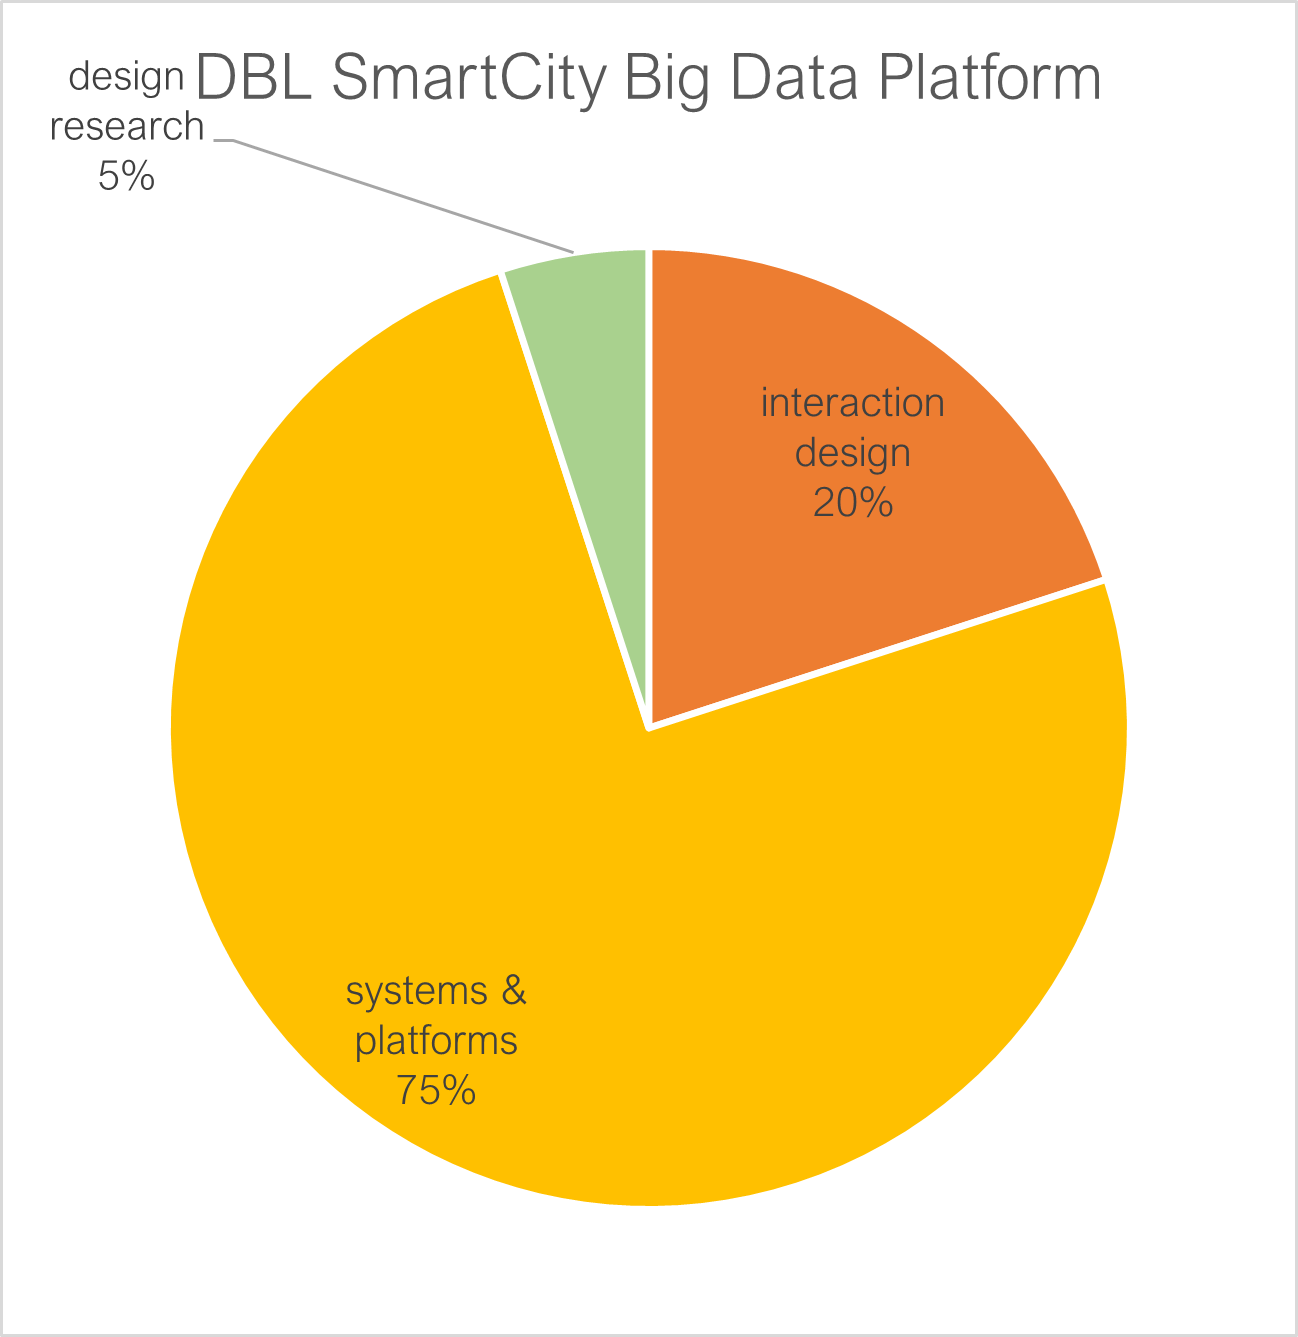
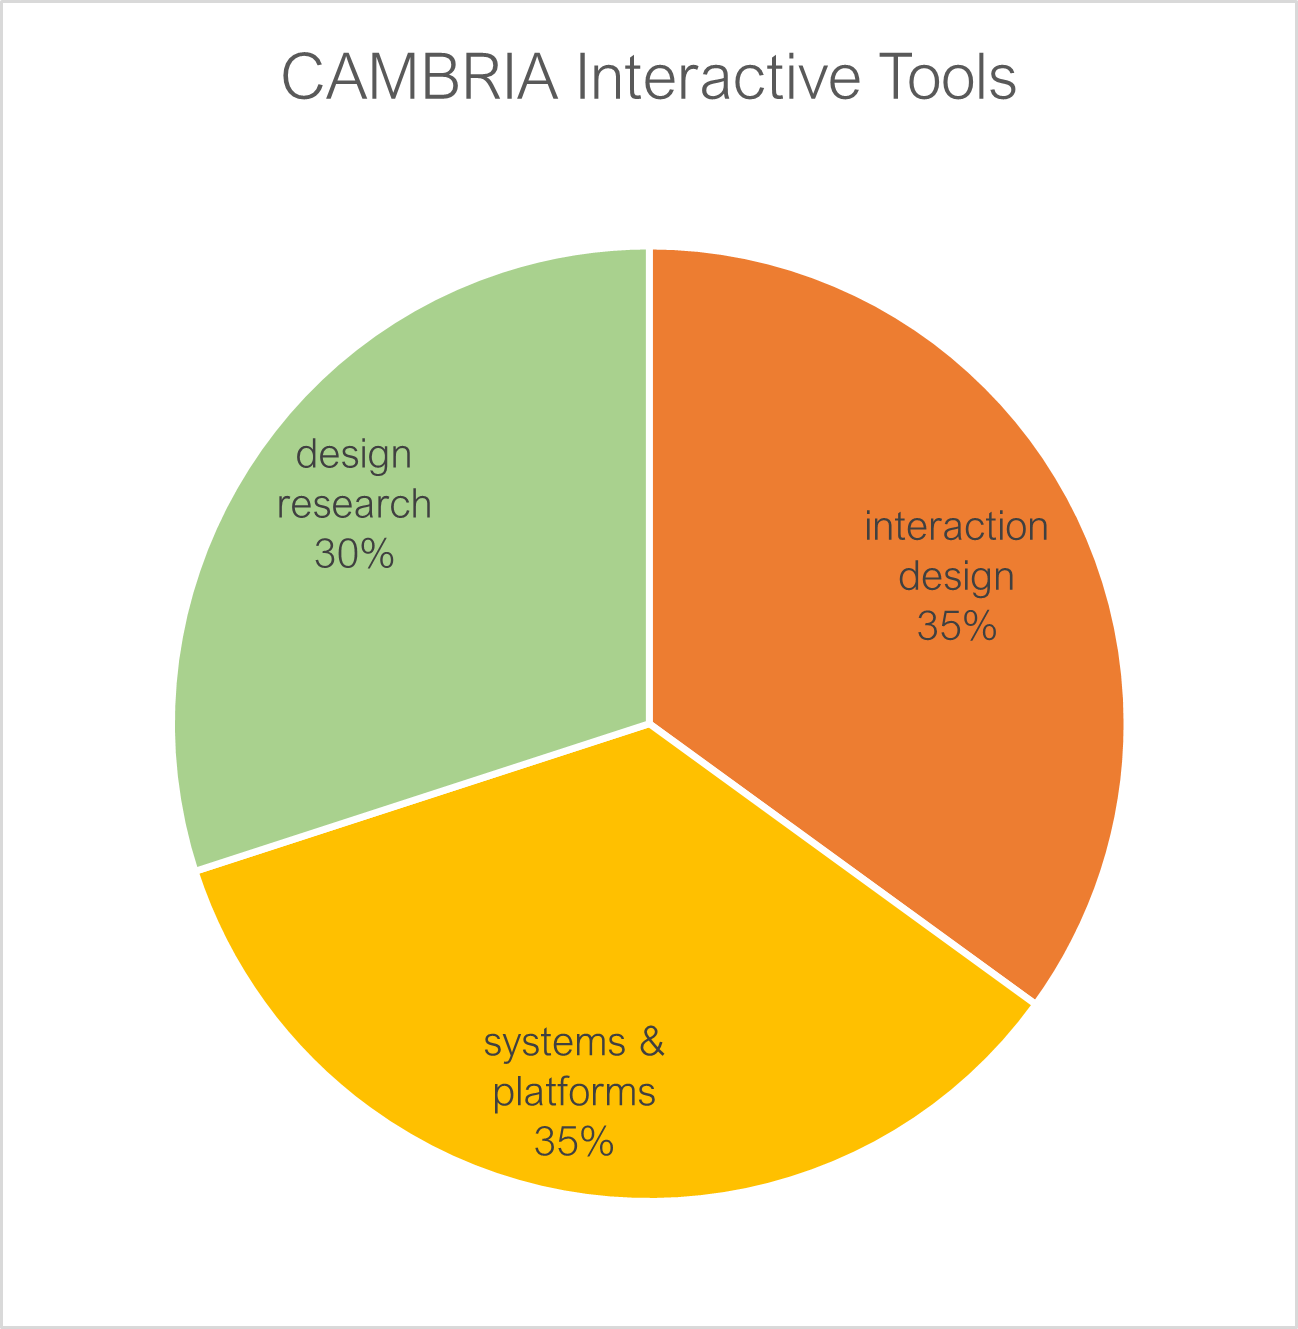
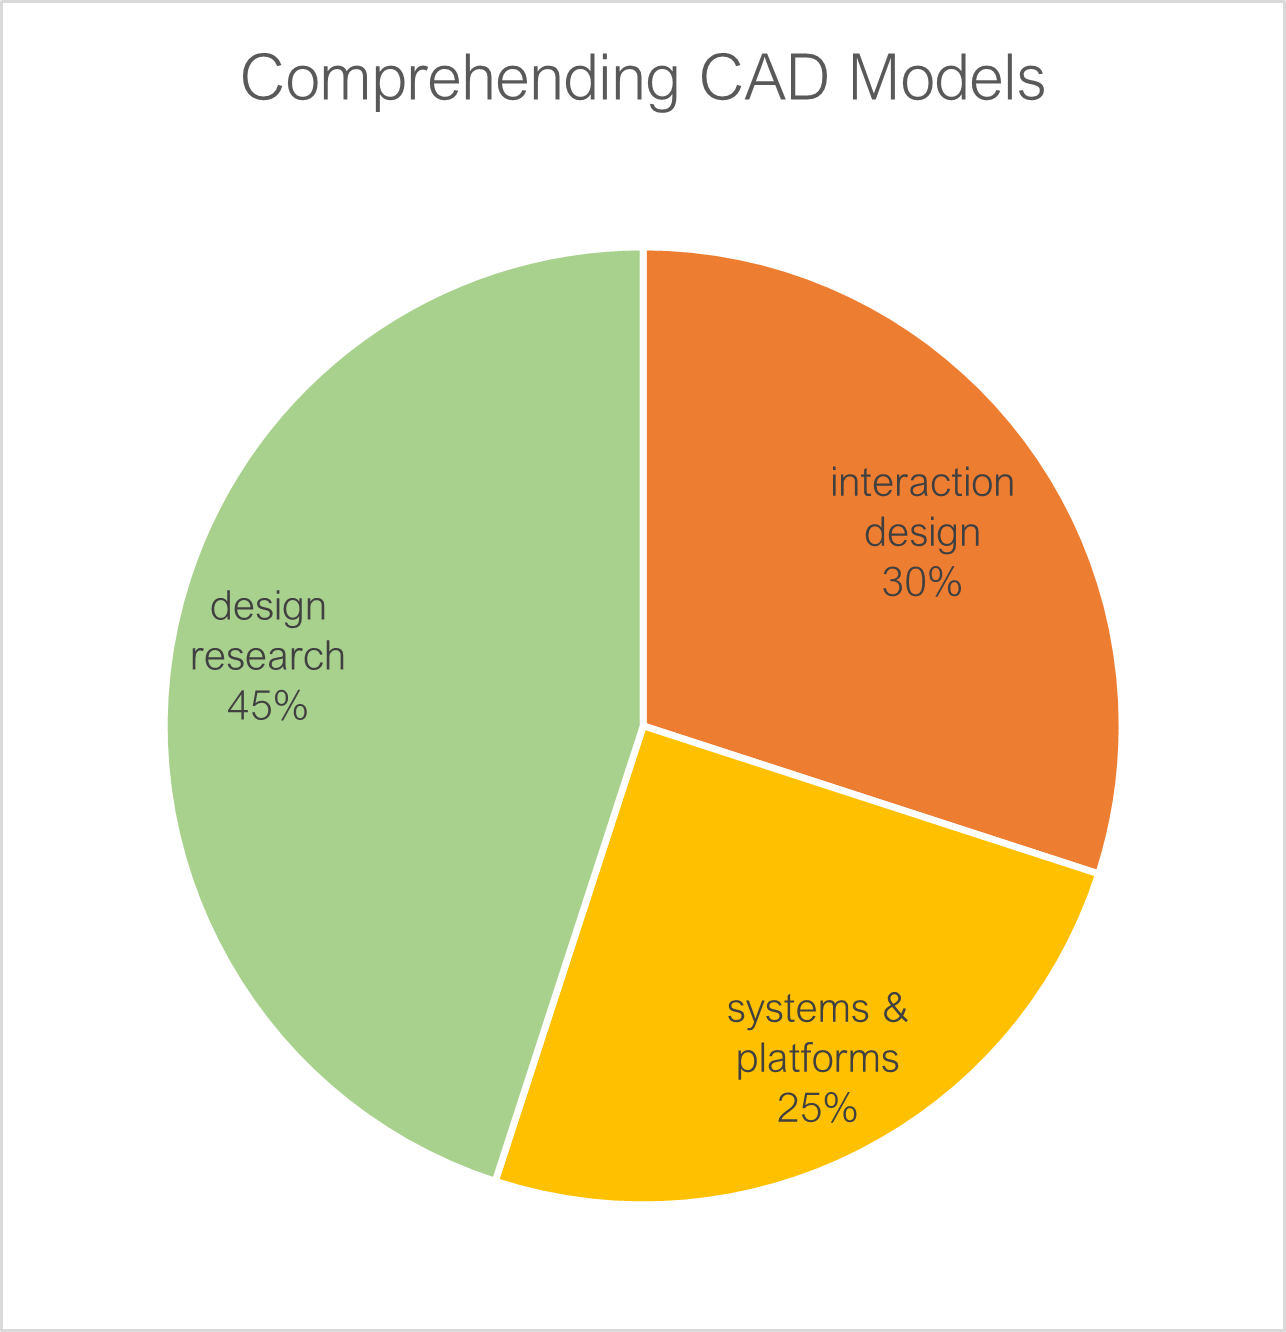
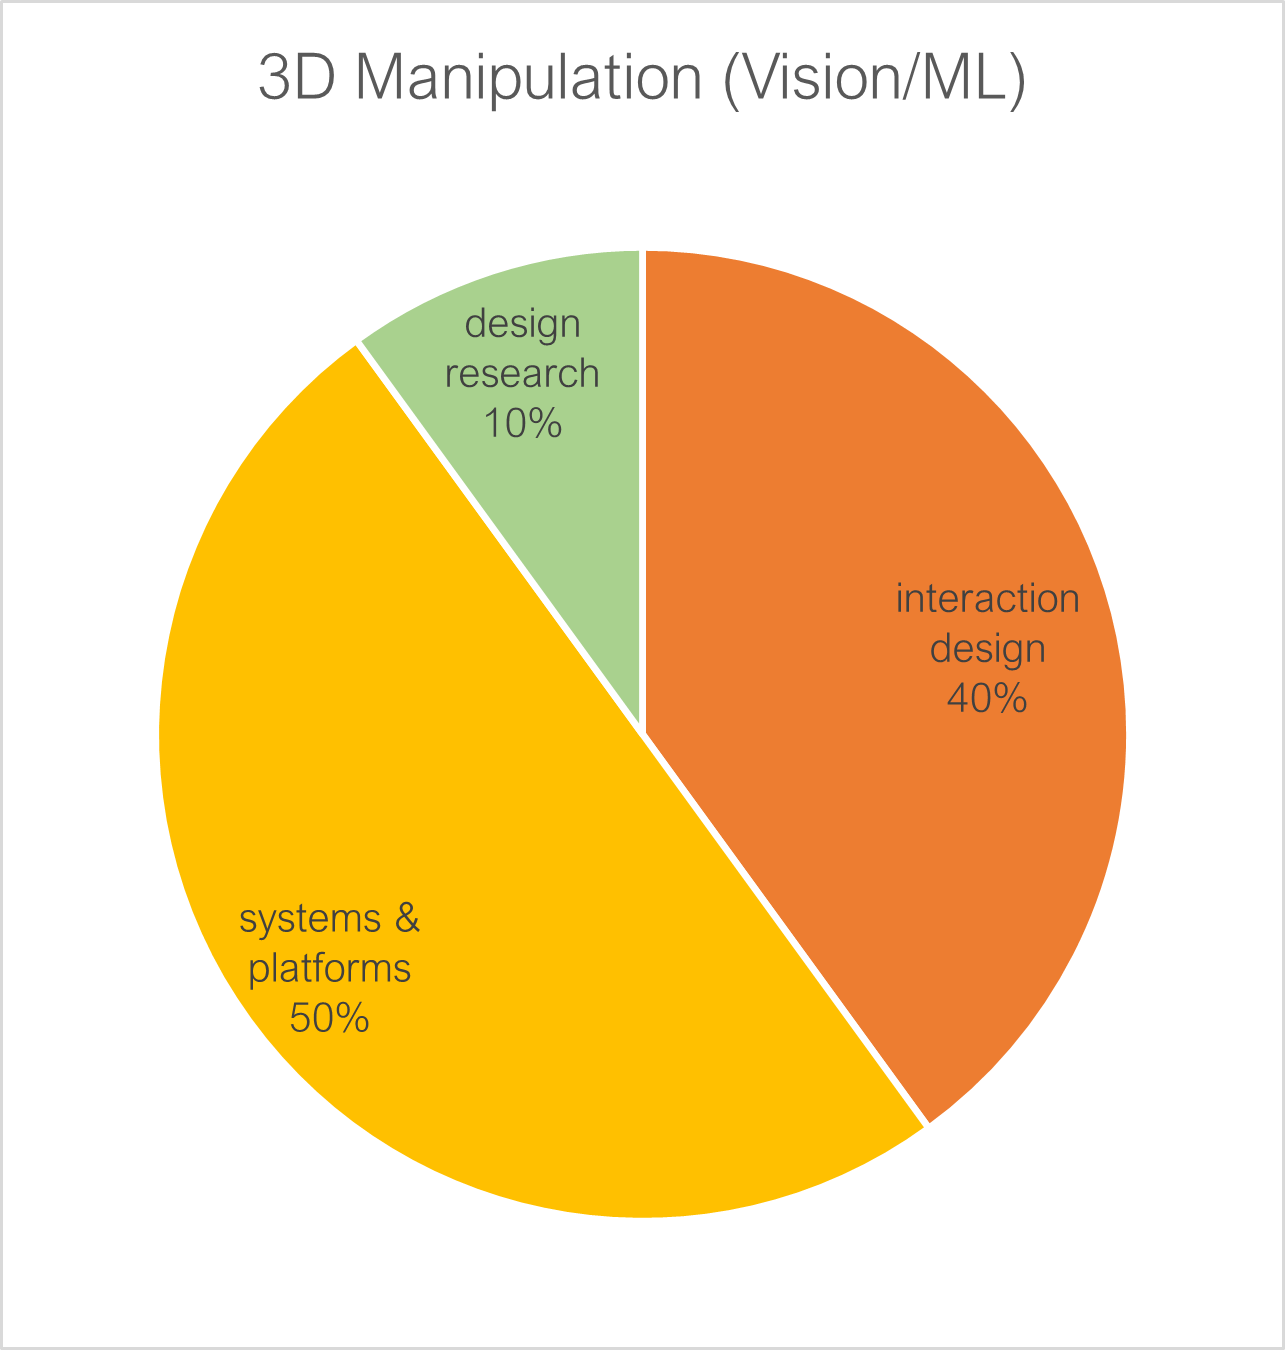
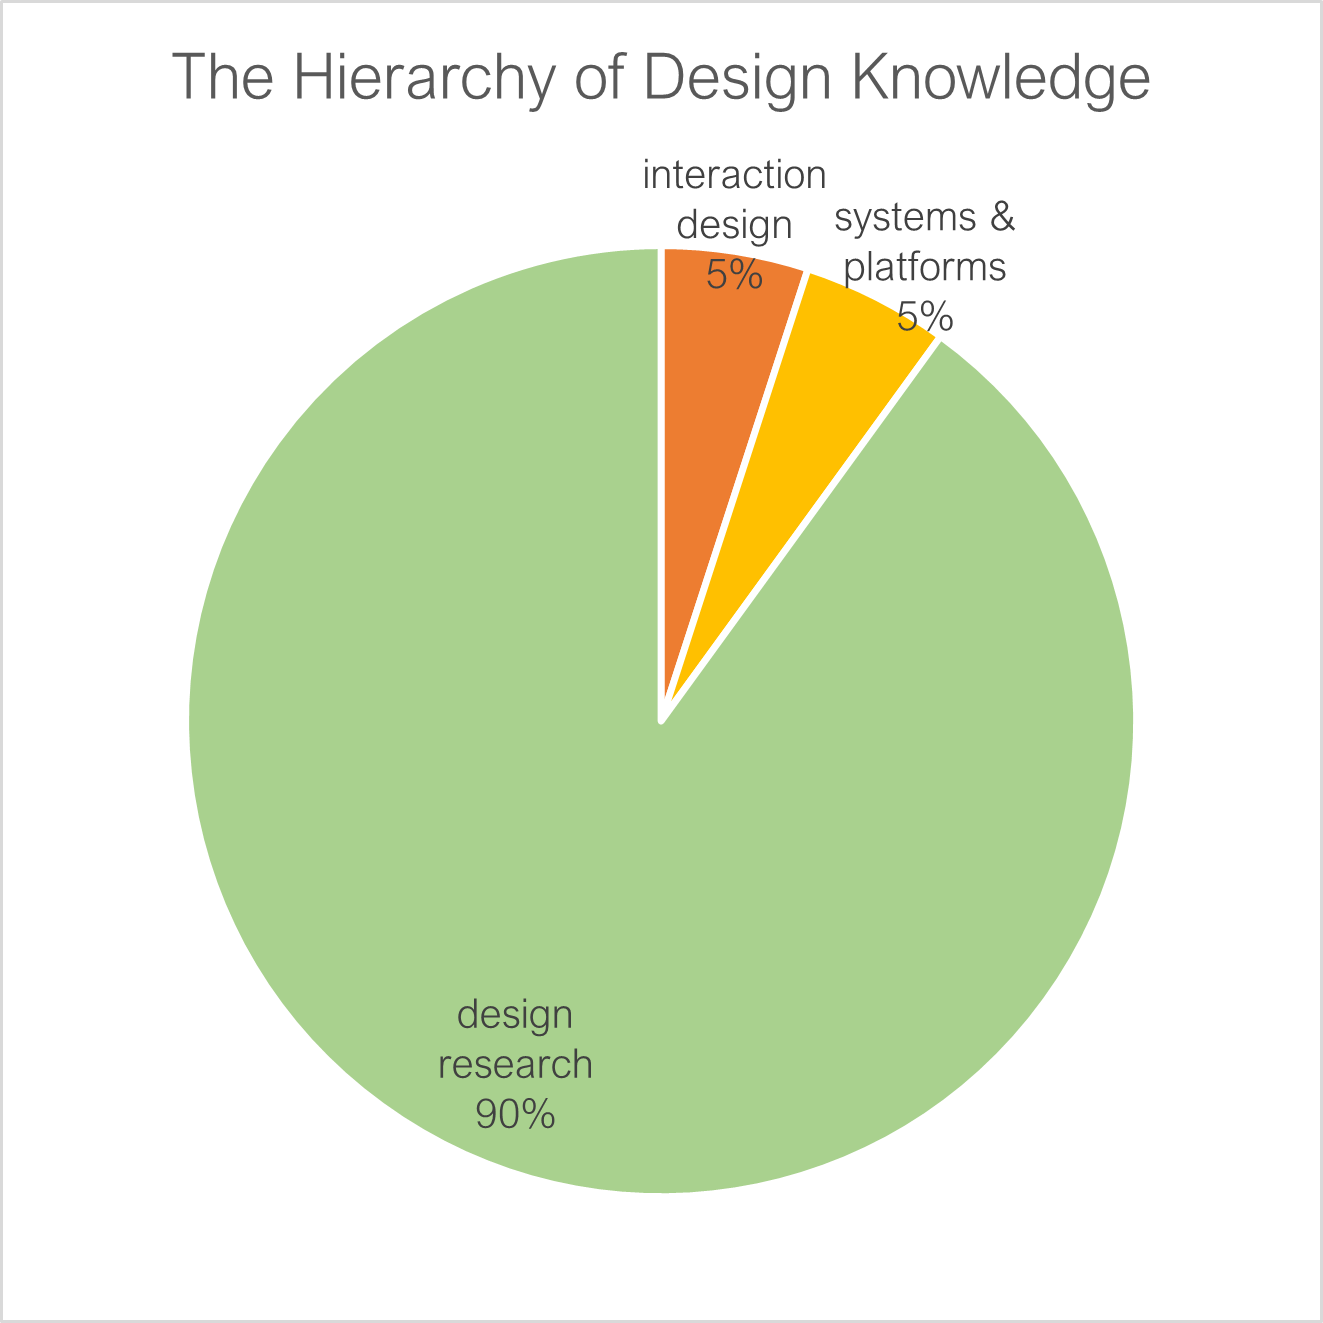
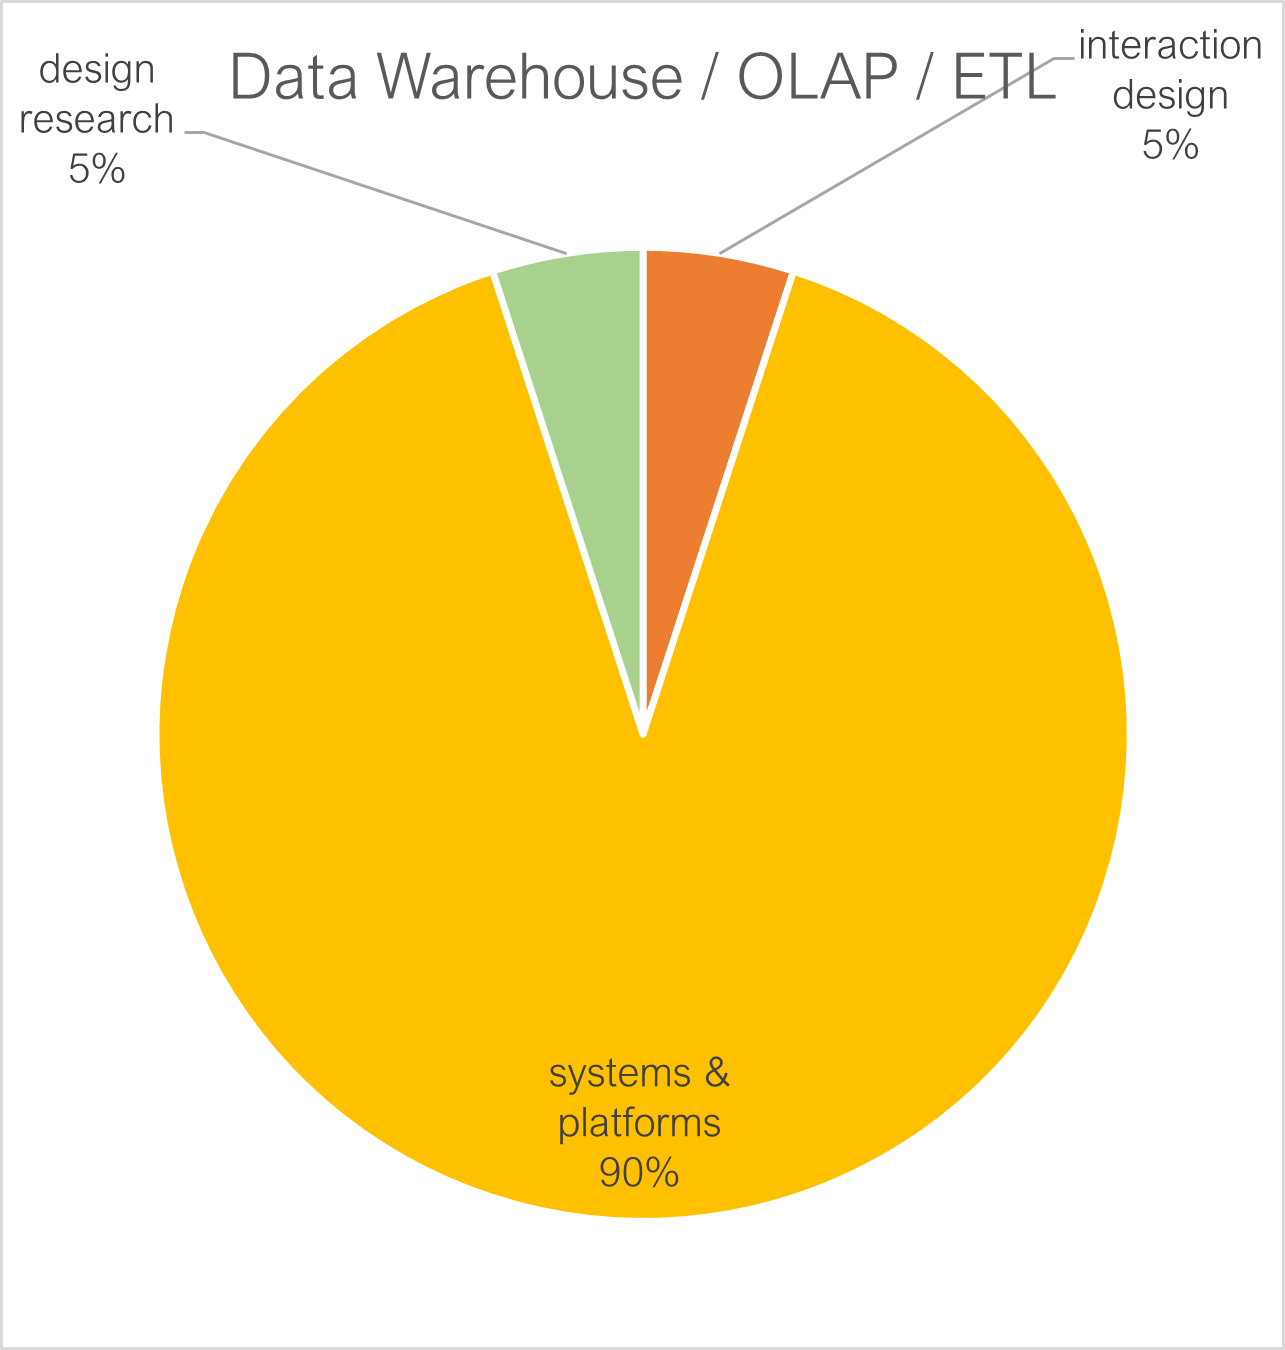
Comparative Analysis of Projects
All the projects above juxtaposed in a grid, with pie charts indicating the approximate proportions of:
- Design research,
- Interaction design, and
- Information systems and platforms (includes big data, data science, and machine learning projects).